

Loading panorama viewer ...
Configuring ...
© 2008 Seb Perez-Duarte, All Rights Reserved.
Caption
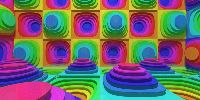
In this computer-generated panorama, I've plotted the slices of the height of a function. Showing the elevation in a map is often done by using contour lines, little wiggly curves for all the points at the same elevation above some reference level. In this case, the floor, walls and ceiling show the function z=sin(x)+sin(y) with shifted colour hues for the different faces of the cube.
Location
Artistica / Virtual worlds
GPS location unavailable (not recorded, no physical location depicted or intentionally suppressed)
Precision is: Suppressed. Will not show on map.
Equipment
Panorama generated with POV-ray, QTVR created with Panotools-Script.
 Tap or click the zoom icon in the bottom right corner of the picture to switch between in-page and fullscreen view